The most recent Consumer Price Index (CPI) data was released and is once again making headlines as the index rose 7.5% for the 12 months ending in January, the largest one-year increase in nearly 40 years. If that last line sounds like a broken record, it’s because the last four announcements starting with last October’s data have all carried that distinction with year-over-year changes consistently higher than 6%. The last time CPI inflation was that high was October 1982.
The Fed received a great deal of criticism for describing inflationary pressures as “transitory” and dropped that label from their official commentary late last year. While that decision has been validated by six consecutive months of accelerating inflation on a year-over-year basis (5.2% à 5.4% à 6.2% à 6.9% à7.1% à 7.5%), we will likely see this trend reverse later this year as the factors contributing to these large increases begin to fade.
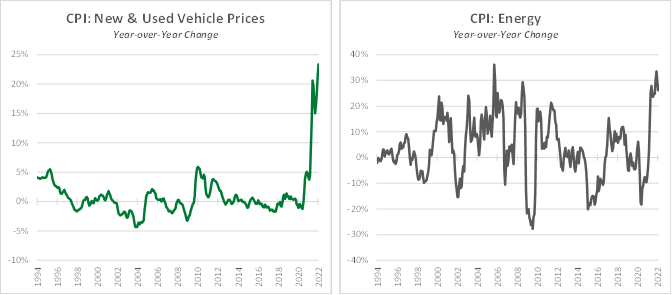
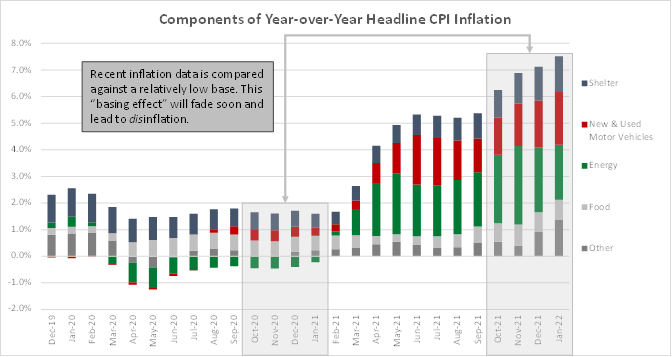
The two main reasons for this deceleration in prices (or disinflation) are 1) the “basing effect” of comparing today’s price index to a time 12 months prior when economic activity was still limited by the pandemic, particularly in the services sector, and 2) relative smaller components of the index having an outsized contribution due to significant price increases that are not expected to be sustained going forward. Take vehicle prices and energy costs as two examples. These categories each comprise ~7-8% of the overall CPI, yet they account for nearly half of the increase in the index over the past 12 months. New and used car prices increased less than 0.5% on average pre-pandemic, but in January vehicle prices had increased more than 20% from the year prior, and energy prices are nearly 30% higher.
It’s highly unlikely that vehicle prices continue to rise at the current pace as supply chain issues ease. In fact, we could experience outright deflation in the vehicle index given its unprecedented increase over the last 12-24 months. And while energy prices could remain at current elevated levels, we don’t believe further increases are likely as high prices incentivize additional capacity and production, thus removing that accelerant from the CPI data. As the chart below shows, the fading of the red (vehicles) and green (energy) components of the index moving forward, combined with the overall basing effect, would result in a significant decline in the inflation readings we see in the second half of this year.
The key risks to this outlook are labor market dynamics and the housing market. Shelter is the single largest component at ~33% of the CPI, and housing price increases tend to have a lagged effect on the index, so we could see continued increases in this component. This will be counterbalanced by increased interest/mortgage rates slowing future activity. As for the labor markets, last Friday’s Employment Report indicated some easing to current tight labor market conditions as new jobs were higher than expected and previous jobs numbers were also increased materially higher, but it’s very early stages here so this is something we’re monitoring extremely closely.
Fed rate hike expectations have been accelerated and increased by investors so far this year. For as much pressure as the Fed is facing now to raise rates, if economic growth and inflation do indeed start to decelerate in the second half of this year, we could very well see a pause in the current expected trajectory and/or magnitude of Fed rate hikes (not to mention what impact politics may have later this year as we approach the midterm elections). This may provide some temporary relief to equity markets later this year, but – for now, at least – “the highest inflation in nearly 40 years!” will be the continued refrain a little while longer.